
Strategy 02 (S2)
Timeframes: 1H and 5M
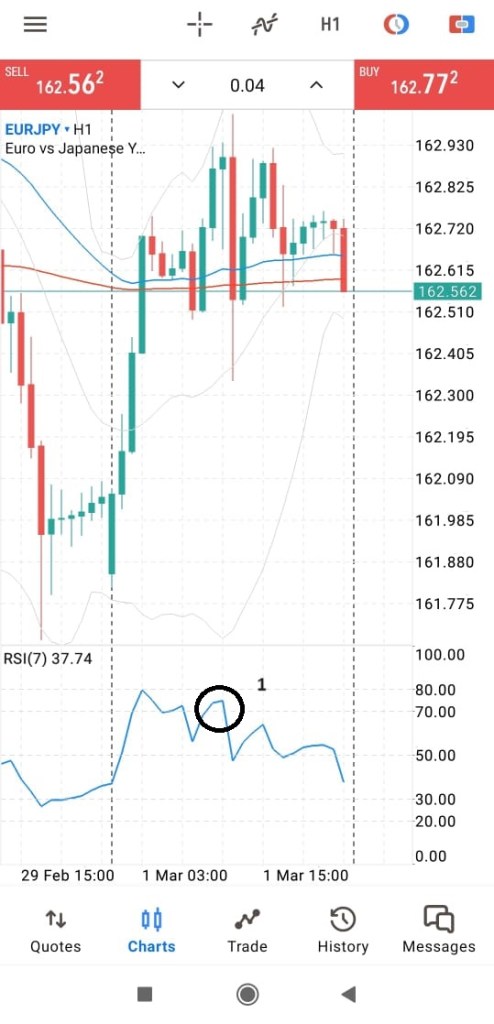
Indicators: RSI(7), BB and 200EMA
This simple strategy starts with 1H timeframe.
Entry watch starts when: The price moves above 70 or below 30 in RSI(7).
The approach is similar to that of S1 here. But the difference here is the way we analyze the 5M chart. Rather than finding a candlestick pattern or any RSI divergence, we will purely focus on the RSI graph to see a specific pattern.
RSI Confirmation
In 5M chart, the RSI line should test either the 70 or 30 lines as shown in the pictures above. The idea behind this is to see a break of trend to either direction and once the signal is visible in RSI, we can enter for the trade.
Notes:
We can add any other confluences to this as well, like candlestick patterns etc. But the idea behind this strategy is to enter for a trade as quickly as possible, so that the risk to reward ratio is optimal (have a smaller stop loss margin compared to S1).
Explanation:
Please refer to the numbers shown in the picture above. These numbers will explain the strategy step by step.
- 1H timeframe, trade entry alert. Once the RSI moves above 70 or below 30, we have the first trade entry alert. This will indicate that possibly we will enter for a trade soon. (If other confirmation factors are satisfied)
- This is a specific pattern to be observed within the RSI graph. In the above picture, the RSI line is having a clear curve above 70 line and just before that, the RSI line has a slight dent as well. This combination should be observed before going further. That is,
- The RSI line should have a slight dent before entering 70 or 30 line.
- The RSI line should have a clear curve above 70 or below 30 line.
- Once the line goes back past that dent (No. 2 on the RSI graph), we are looking for a trade entry. Once that is observed, we need to look at the price chart to see candlestick patterns such as, wicks, dojis or swing highs or lows.
