Strategy 01 (S1)
Timeframes: 1H and 5M
Indicators: RSI(7), BB and 200EMA
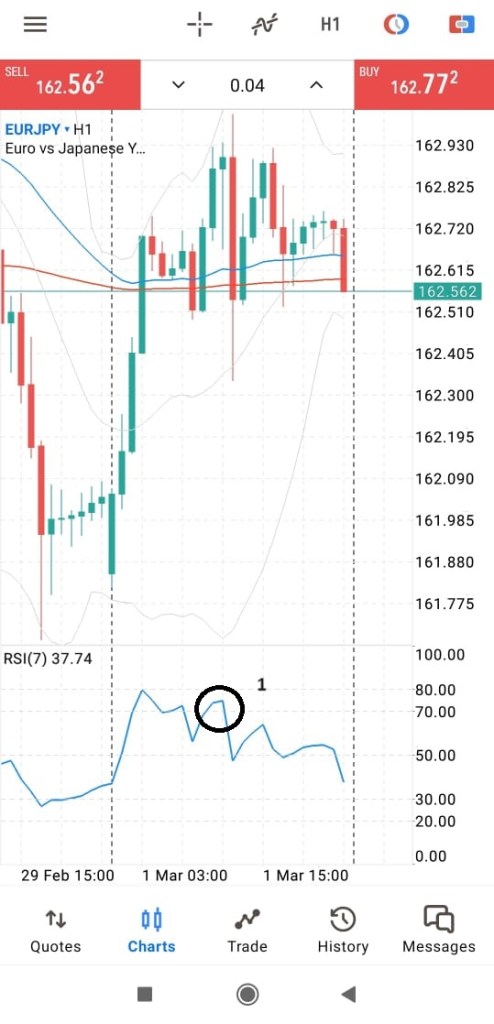
This simple strategy starts with 1H timeframe.
Entry watch starts when: The price moves above 70 or below 30 in RSI(7).
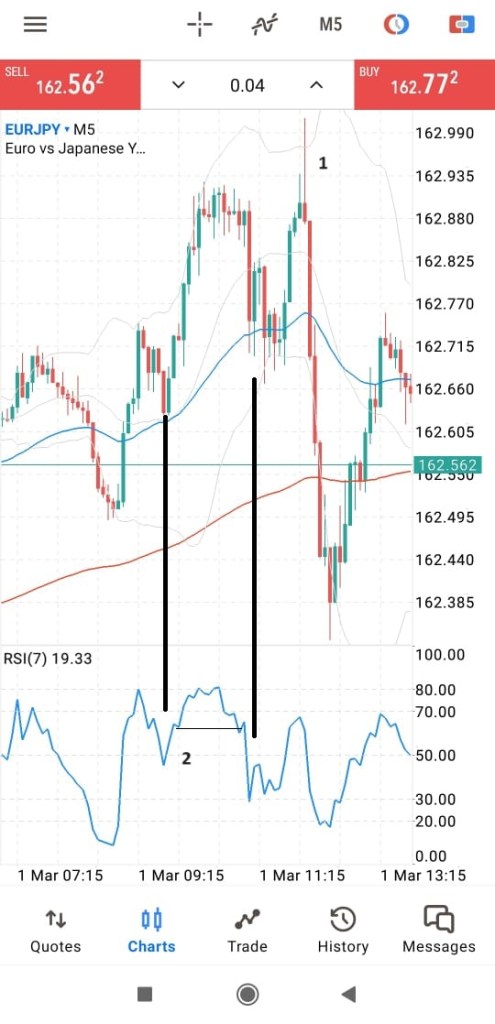
Now, we should start studying how the price moves in 5M chart. All the analysis should be done in this timeframe. What we are looking at is a reverse of price from the current position to up or downside. Therefore, we need to have clear evidence of price reversal from this point. In order to arrive at the decision, we are going to use the RSI divergence as the confirmation of price reversal (please see the details in the images attached here). Once the divergence is confirmed, we can trigger an entry right away.
Extra Confirmation
To make the entry perfect, we can use Bollinger Band as an extra confirmation. The price should be rejected from either of the outer BB line. In addition to that, the use of candlestick patterns will also be considered, such as double or triple top formation, pin bars or doji candles. Another effective method is to observe the wicks of the candles to see any supporting confirmations towards the side of trading.
Explanation:
Please refer to the numbers shown in the picture above. These numbers will explain the strategy step by step.
- 1H timeframe, trade entry alert. Once the RSI moves above 70 or below 30, we have the first trade entry alert. This will indicate that possibly we will enter for a trade soon. (If other confirmation factors are satisfied)
- (Refer strategy 2 for explanation)
- 5M timeframe, price has rejected the BB outer line. This is taken as an extra confirmation. What is important here is the 2 vertical lines shown in the picture. This indicates a good enough form of RSI divergence. Once the divergence is confirmed, we are looking at extra confluences, hence the point 3.
When we have above facts satisfied, we can enter for a trade having enough number of pips for SL and TP. I can not tell exactly the number of pips to use here as it differs from price structure and how volatile the market is at a given time.
